How to visualize a crowded mind that results from extensive screen time?
That was my first task as an intern at MAD, and not a simple one. The visualization brief was partly created by myself and partly inspired by ideas of my MAD colleagues. For the next three months it will form the basis for my own software project, including a research phase, conceptualisation phase and execution phase. Throughout the project I will engage in ideation, UI/UX, design, system architecture and development alike. This blog follows the project step-by-step, starting from February.
Background
When I started the internship, there was already an interest in alternative ways for visualizing browser history at MAD. I, on the other hand, have my background in feature writing. As a creative coder I'm especially excited about artistic applications of deep learning. In the project, it started to feel natural to focus on online texts that we consume daily. The goal is to make a visual representation of that experience, with the help of machine learning.
When it comes to data visualization, I find Marcin Ignac’s approach interesting. Besides leading the studio Variable, he has explored algorithmic identities and metadata in his own artworks. Here, numeral data is translated into 3D space. This approach with data and space resonated with me, as during the pandemic we consume online contents while being confined to our homes. Our headspace increasingly reflects the online space where we spend our days.
During the last week’s ideation phase, I came up with an idea of textual data as a room with clutter and furniture. Rem Koolhaas talks about junkspace, referring to flashy and unmemorable chunks of modern architecture that will be left behind on Earth. Would our browser history or Twitter habits reveal similar kind of junkspace if we dared to take a look?
MVP
These ideas are broad, so it became necessary to define an MVP. After talking with others, I decided that my first goal would be a simple web app that is able to process text data with some NLP libraries and then manipulate 3D primitives based on the result. In practice, this could mean that the number of negative tweets from user X is visualized with a red sphere, its size reflecting the amount of tweets. Later on I could get more ambitious with the 3D objects and data sources (like browser history). One option is to reflect the idea of public and private spaces in the visuals: maybe Twitter visuals could live as sculptures and trees in a park and browser data visuals in a more private setting of a room with furniture and plants.
For NLP, I wanted to dive into Python libraries. Node.js has handy packages like Natural, but Python’s selection of libraries is simply more diverse and able to handle large corpuses of text with a breeze. Additionally, I’m more experienced with Node.js than Python’s web frameworks Django and Flask so this felt like a good opportunity to learn new things with Python.
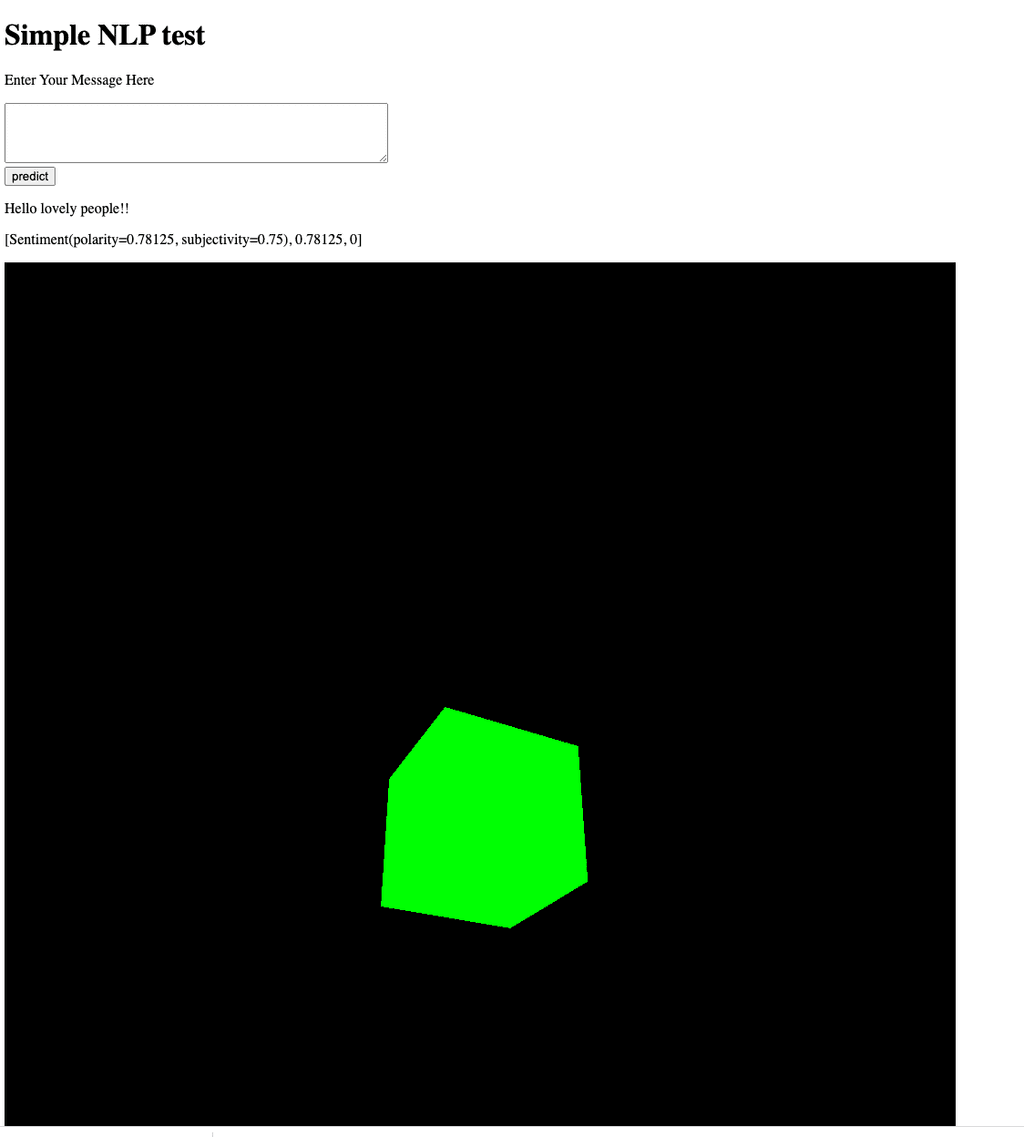
After talking with my developer colleague Nikolai, we concluded that the best approach is to first build a simple Flask app that communicates with Three.jsfront end. As my first experiment, I built a simple app that analyzes user input with an NLP library textBlob. With a few lines of code, the NLP library outputs the subjectivity and polarity of the user input (sentiment), then the polarity separately and finally the number of times a certain word (“UK”) is mentioned.
I also added a simple 3D scene based on a Three.js tutorial. The NLP results are not affecting the 3D visual yet, but they now exist happily in the same Flask app for the next week!